Mapping Viewer Migration Trends Between Peak NBA Seasons and International Soccer Tournaments via Platform Analytics
Written by Jordan Hansen · Jun 6, 2026
Mapping Viewer Migration Trends Between Peak NBA Seasons and International Soccer Tournaments via Platform Analytics
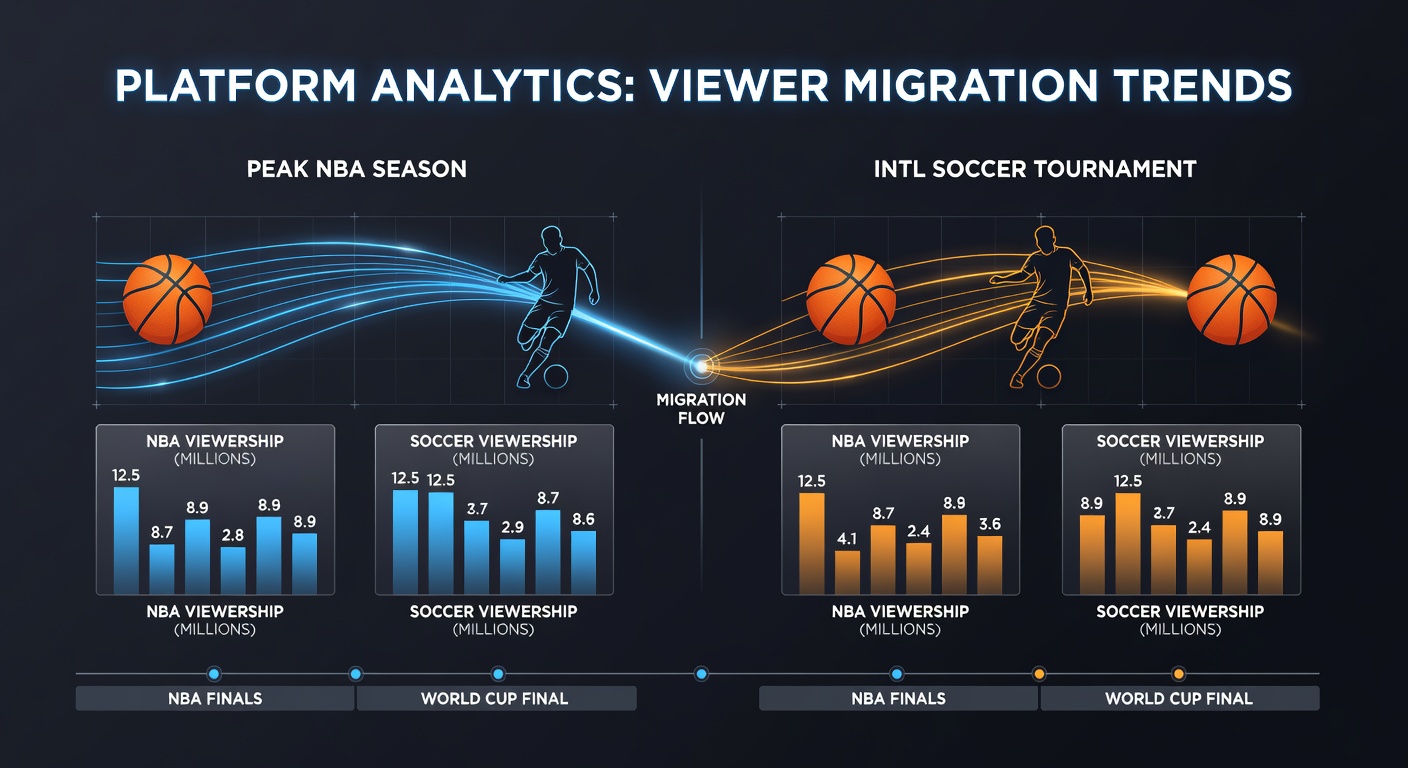
Platform analytics have become central to tracking how audiences shift attention between major sports leagues when schedules create direct overlaps, and this process reveals measurable patterns in viewer behavior across digital services. Data collected from streaming applications shows consistent movement away from NBA playoff games toward international soccer events during periods of simultaneous high-profile matches, with the trends becoming especially clear in multi-week tournament windows. Researchers who examine these shifts rely on metrics such as concurrent viewership counts, session duration changes, and device-level switching logs to map the flow between content categories.
Data Collection Methods Used by Streaming Services
Streaming platforms gather information through built-in tracking tools that record when users pause one event and begin another, and these logs allow analysts to identify migration corridors without relying on self-reported surveys. Companies compile aggregated datasets that break down traffic by region, time zone, and content type, which produces maps of viewer movement between basketball and soccer broadcasts during overlapping calendar periods. Studies conducted by academic groups have applied similar techniques to public datasets, confirming that migration spikes align with the start times of marquee soccer matches rather than random fluctuations.
Observed Patterns During Overlapping Seasons
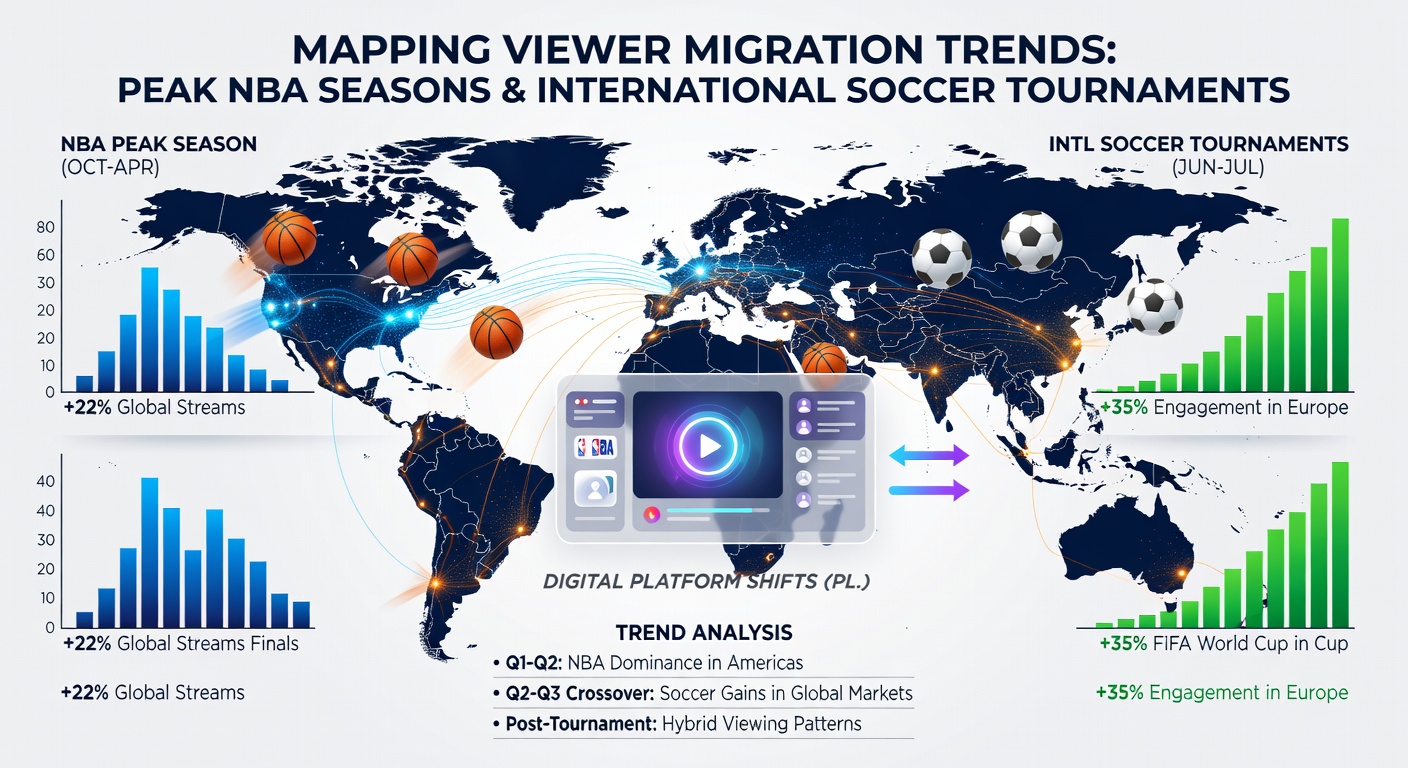
Viewership records indicate that NBA playoff audiences in North American markets often decrease by measurable percentages when European club competitions or national team tournaments reach knockout stages, while soccer audiences in the same regions show corresponding increases. Platform logs further demonstrate that many users maintain active sessions across both sports by employing multi-window viewing or rapid channel switching, which creates hybrid consumption profiles rather than complete abandonment of one league. Figures from industry reports reveal that these partial migrations occur most frequently in evening time slots where an NBA conference final precedes or follows a soccer group stage match by less than two hours.
Role of Scheduling in June 2026
The 2026 FIFA World Cup schedule places several group stage matches in mid-June, a window that coincides with the tail end of NBA playoff contention for remaining teams, and platform analytics already project measurable audience redistribution during those specific dates. Historical data from prior international tournaments shows that viewers in Asia-Pacific markets tend to shift earlier in the day toward soccer coverage, while European audiences exhibit later evening transitions that align with prime-time NBA windows. Analysts who model these overlaps use historical session data to forecast bandwidth demand and content recommendation adjustments ahead of the June 2026 calendar.
One research team at an Australian university examined public streaming telemetry from the 2022 tournament cycle and identified clear corridors of migration between basketball and soccer streams, with the patterns repeating across multiple device types adn subscription tiers. Their methodology relied on timestamped event markers rather than demographic assumptions, which allowed them to isolate the effect of tournament scheduling from other variables such as weather or competing entertainment releases.
Regional Variations in Migration Behavior
European viewers display higher rates of rapid switching between NBA late-night games and daytime soccer fixtures, whereas North American audiences show more sustained blocks of soccer viewing once they transition away from basketball content. Data collected across Latin American markets indicates that soccer tournament matches draw larger shares of total platform traffic during NBA off-peak hours, yet basketball retains strong loyalty when matches occur in local evening slots. These geographic differences emerge consistently in aggregated analytics dashboards that segment traffic by country and language preference settings.
Technical Tools Supporting Trend Analysis
Modern analytics suites combine real-time viewership counters with machine learning classifiers that categorize content switches according to sport type and match importance, which enables rapid identification of migration events as they unfold. Developers integrate these classifiers into recommendation engines so that platforms can surface soccer alternatives when NBA viewership begins to decline at predicted overlap points. Government statistical agencies in Canada have published supplementary datasets on digital media consumption that researchers cross-reference with proprietary platform figures to validate observed trends across broader population samples.
Implications for Content Delivery Networks
Content delivery networks adjust server allocation and edge caching strategies based on predicted migration volumes, which reduces latency during periods when soccer tournaments siphon viewers from NBA streams. Network operators monitor the same analytics feeds used by platforms to anticipate regional load spikes and maintain consistent delivery quality across both sports categories. Reports from international telecommunications bodies document how these adjustments have stabilized service during past tournament overlaps without requiring manual intervention at individual nodes.
Conclusion
Platform analytics provide a detailed record of how audiences navigate between peak NBA seasons and international soccer tournaments, and the resulting migration maps inform both scheduling decisions and technical infrastructure planning. Continued refinement of these measurement techniques will likely produce even more granular insights into viewer behavior as additional data sources become available ahead of the 2026 calendar cycle. Observers note that the patterns already visible in current datasets establish a baseline for understanding future overlaps between these two major sports properties.